Dataset
The dataset named ‘Default of Credit Card Clients’ comprises information pertaining to credit card holders in 2005 at Taiwan, encompassing various demographic and financial attributes. Each entry is uniquely identified by an ID. The dataset includes the credit limit (LIMIT_BAL) assigned to each individual, their gender (SEX), level of education (EDUCATION), marital status (MARRIAGE), and age. Additionally, it contains details on the repayment status (PAY_0 to PAY_6) over the past six months and it’s scale: -1 = pay duly; 1 = payment delay for one month; 2 = payment delay for two months; …; 8 = payment delay for eight months; 9 = payment delay for nine months and above., bill amounts (BILL_AMT1 to BILL_AMT6), and payment amounts (PAY_AMT1 to PAY_AMT6) during the same period. The final column indicates whether the individual defaulted on their payment in the following month (default payment next month). This dataset holds potential for comprehensive analyses to discern patterns in credit card usage, repayment behavior, and factors influencing default occurrences among different demographic groups.
| Column Names | Type | Description | Modified Column Names |
|---|---|---|---|
| ID | Categorical/Numerical (Identifier) |
Unique identifier for each credit card holder. | ID |
| LIMIT_BAL | Numerical (Continuous) |
Credit limit assigned to each credit card holder. | Limited_Bal |
| SEX | Categorical (Male/Female) |
Gender of each credit card holder. | Gender |
| EDUCATION | Categorical (University/Grad/High_school/ Others/PG/Advanced_degree) |
Educational level of each credit card holder. | Education |
| MARRIAGE | Categorical (Married/Single/Others) |
Marital status of each credit card holder. | Marriage |
| AGE | Numerical (Continuous) |
Age of each credit card holder. | Age |
| PAY_0 | Categorical (Ordinal) |
Repayment status in September | Repay_Sept |
| PAY_2 | Categorical (Ordinal) |
Repayment status in August | Repay_Aug |
| PAY_3 | Categorical (Ordinal) |
Repayment status in July | Repay_Jul |
| PAY_4 | Categorical (Ordinal) |
Repayment status in June | Repay_Jun |
| PAY_5 | Categorical (Ordinal) |
Repayment status in May | Repay_May |
| PAY_6 | Categorical (Ordinal) |
Repayment status in April | Repay_Apr |
| BILL_AMT1 | Numerical (Continuous) |
Bill statement in September | Billpay_Sept |
| BILL_AMT2 | Numerical (Continuous) |
Bill statement in August | Billpay_Aug |
| BILL_AMT3 | Numerical (Continuous) |
Bill statement in July | Billpay_Jul |
| BILL_AMT4 | Numerical (Continuous) |
Bill statement in June | Billpay_Jun |
| BILL_AMT5 | Numerical (Continuous) |
Bill statement in May | Billpay_May |
| BILL_AMT6 | Numerical (Continuous) |
Bill statement in April | Billpay_Apr |
| PAY_AMT1 | Numerical (Continuous) |
Amount paid in September | Amtpaid_Sept |
| PAY_AMT2 | Numerical (Continuous) |
Amount paid in August | Amtpaid_Aug |
| PAY_AMT3 | Numerical (Continuous) |
Amount paid in July | Amtpaid_Jul |
| PAY_AMT4 | Numerical (Continuous) |
Amount paid in June | Amtpaid_Jun |
| PAY_AMT5 | Numerical (Continuous) |
Amount paid in May | Amtpaid_May |
| PAY_AMT6 | Numerical (Continuous) |
Amount paid in April | Amtpaid_Apr |
| default payment next month | Categorical (Default/Not Default) |
Indicates whether the individual defaulted on their payment in the following month. | default_payment_next_month |
Data Analysis:
The above graph showcases a structured presentation of demographic data, specifically focusing on the intersection of age and educational attainment. The “Education” column categorizes individuals into groups like “Advanced_degree”, “Grad”, “High_school”, “PG (Post Graduation)”, “Others”. X-axis represents the age and Y-axis represents the credit limit of the individuals. The information can potentially be utilized to understand the educational demographics within certain age groups and to inform their respective credit limits.
The graph provides an interpretation of a scatter plot with smooth trend lines depicting the relationship between age and credit limit across various educational backgrounds. It breaks down the trends observed in the data for each educational category and age group, highlighting how credit limits change with age within each educational group. The interpretation considers factors such as career trajectories, earning potential associated with different levels of education, and the variance in credit limits within each category. It also discusses the statistical methods used, such as smooth lines, to reveal overall trends while minimizing the influence of individual data points. Overall, the visualization offers valuable insights into the impact of educational background on financial credibility, aiding both financial institutions in assessing credit risk and individuals in understanding their financial standing relative to their education level.
The histogram of age distribution in the dataset reveals several important insights. Firstly, it highlights a concentration of individuals in their late 20s to early 40s, likely representing those in the midst of their careers. Secondly, it shows a right-skewed distribution, indicating a predominance of younger individuals, which could suggest a younger population or a higher propensity for credit among the younger demographic. Thirdly, the histogram’s use of 5-year bins effectively visualizes age distribution without oversimplification, with the highest frequency bars clustered around 25 to 35 years. Fourthly, the implications for financial products are significant, as institutions may tailor offerings and marketing strategies to cater to the economically active age group. Lastly, lower frequencies among older age groups prompt considerations for how financial services are tailored, particularly in regions with varying age demographics. Overall, the distribution underscores the importance of understanding age dynamics in shaping credit risk assessment, product design, and marketing strategies within the financial sector.
The bar chart illustrates the gender distribution within the dataset, revealing a higher representation of females compared to males. This suggests potential gender-based differences in credit application or dataset composition. The visualization’s simplicity aids in comparing gender counts effectively. Financial institutions can leverage this insight to tailor services and marketing strategies to better suit the demographic composition.
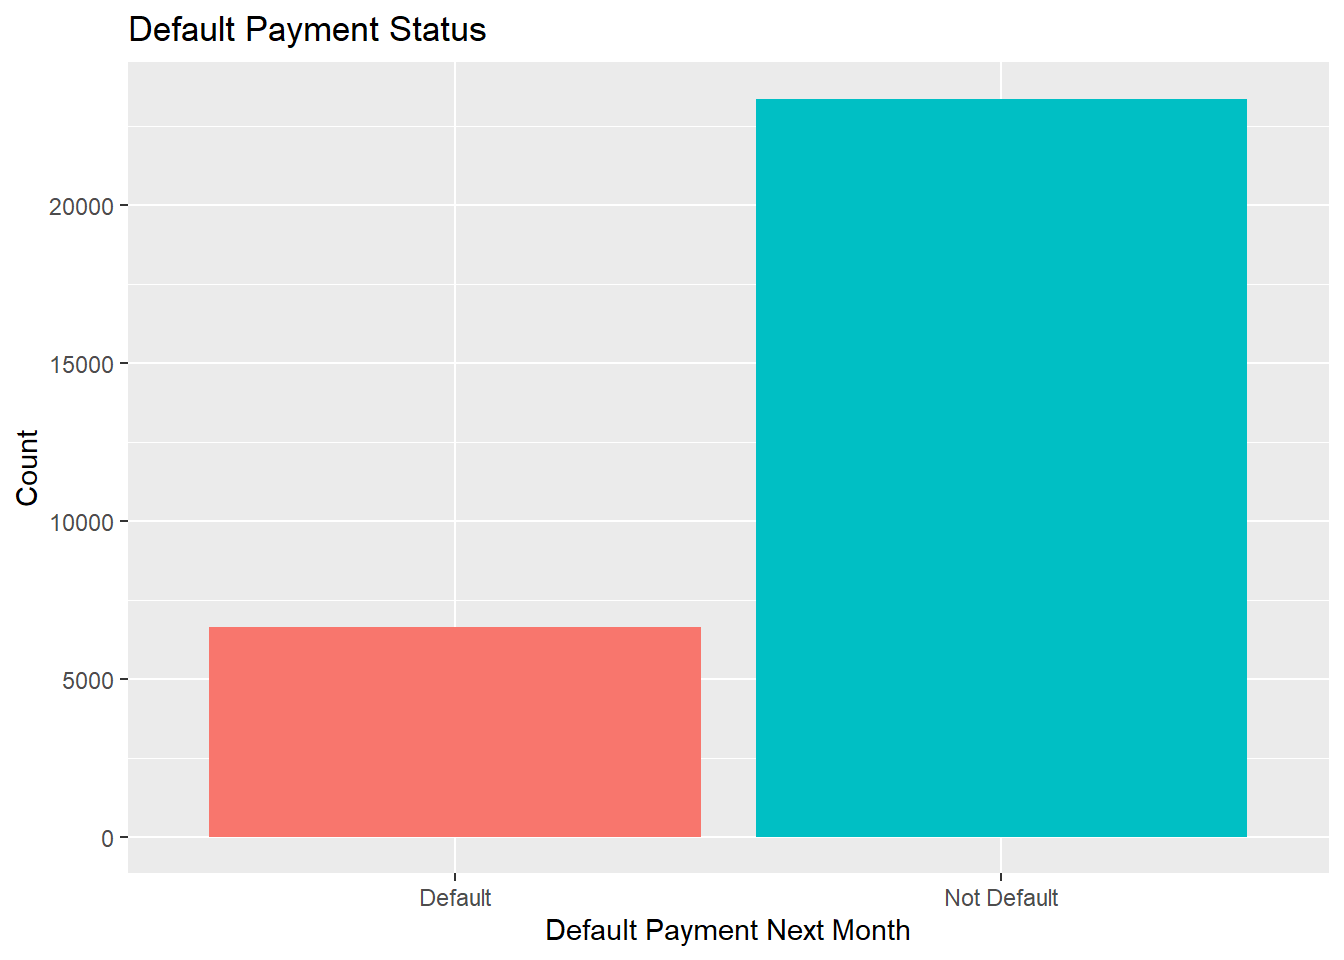
The bar chart depicts the distribution of default payment status for the next month, highlighting a majority of individuals expected not to default. This insight is vital for risk management, allowing financial institutions to tailor strategies to mitigate default risk effectively. The visualization’s clarity, with color-coded bars and direct labeling, facilitates easy comprehension of default status distribution. It informs business strategies such as provisioning for bad debts and designing credit products, ultimately aiding in strategic planning and operational adjustments in financial services.